
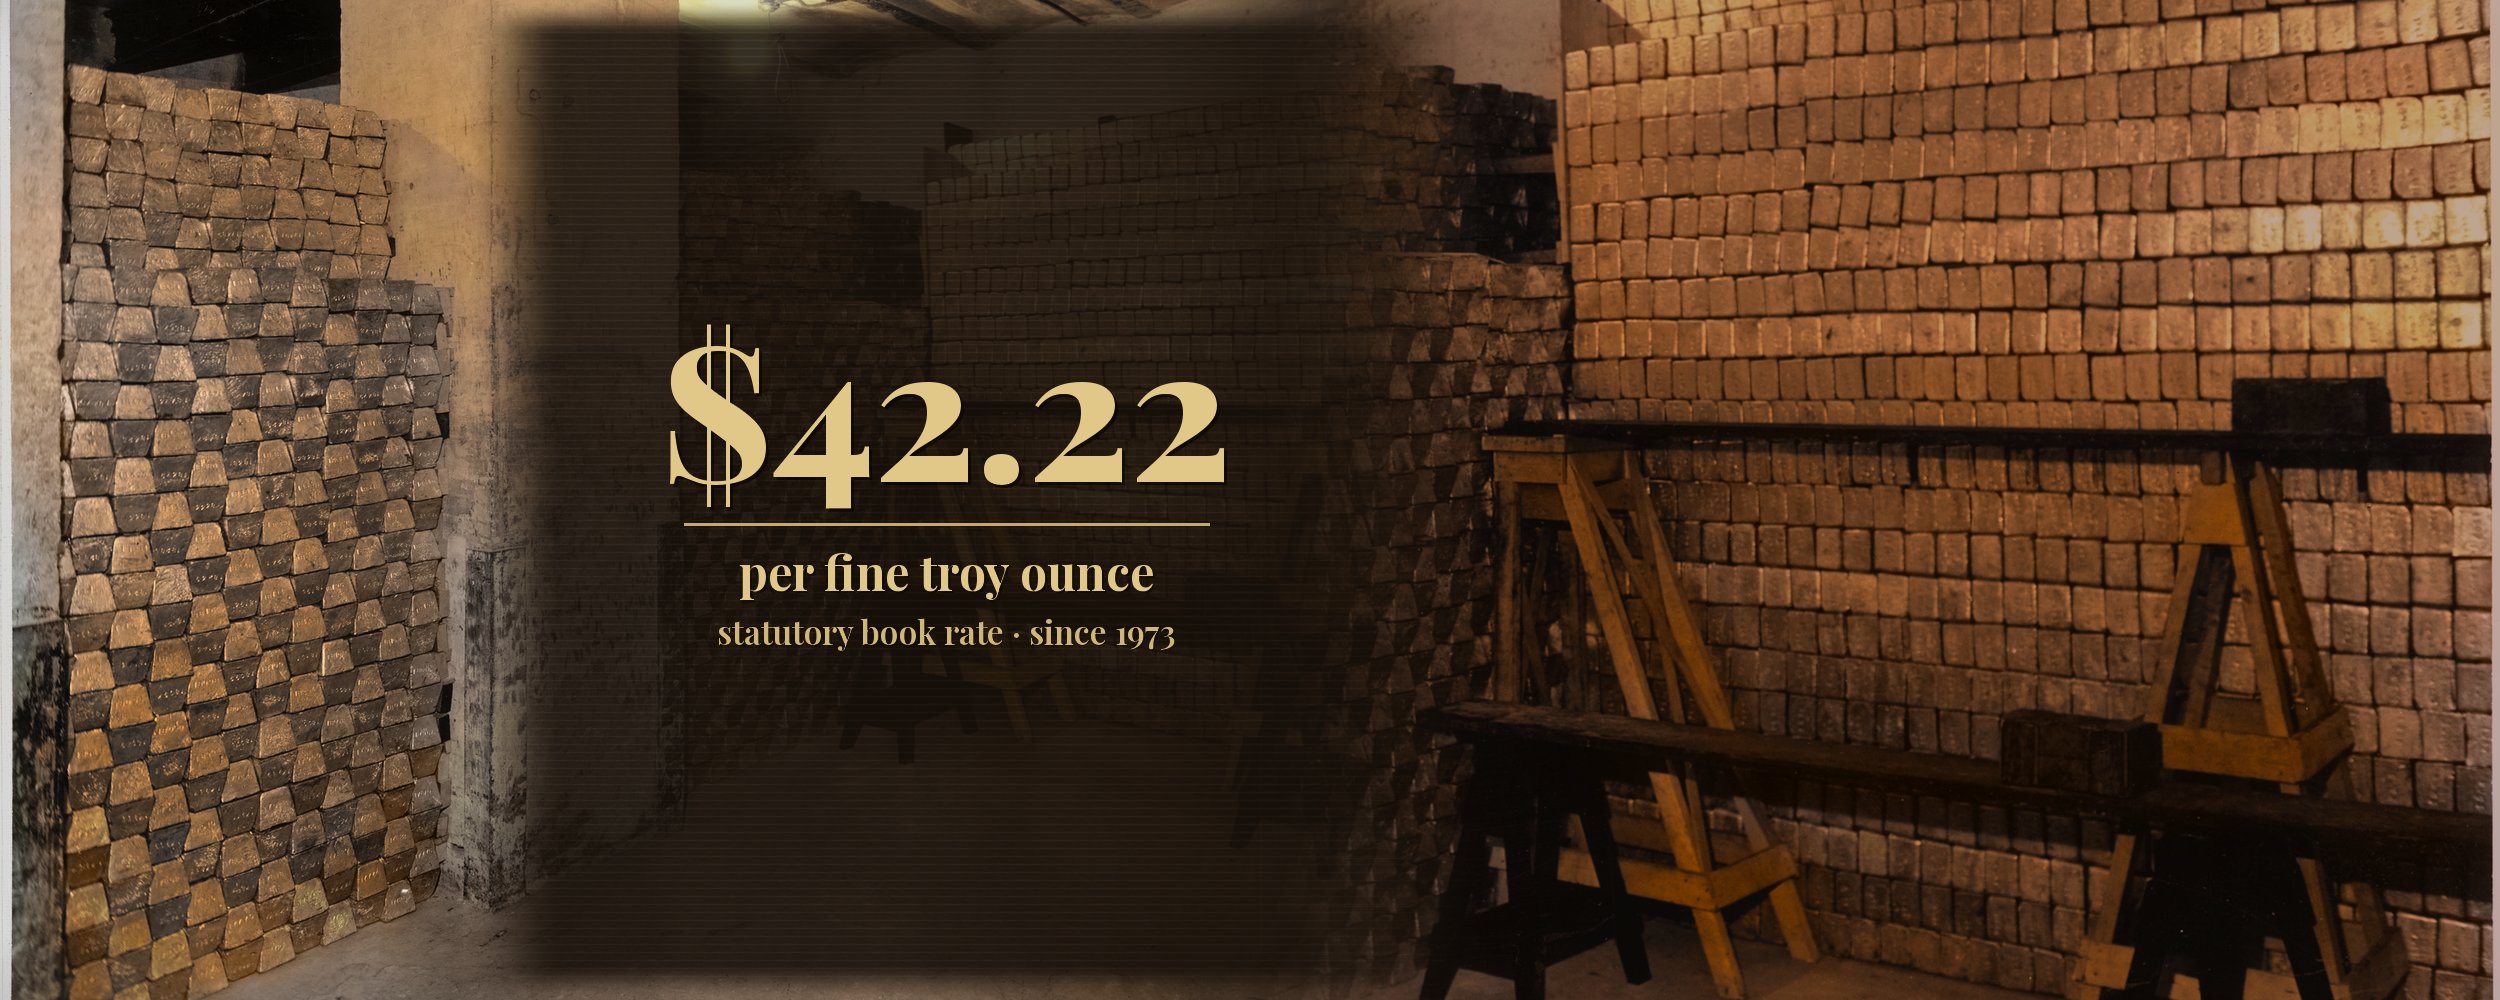
Walk into the official ledgers of the United States and the gold still sits at about forty-two dollars and twenty-two cents a fine troy ounce. Not four thousand. Not whatever the spot printed this morning. Forty-two twenty-two — the statutory gold-certificate price written into U.S. law, and used for those certificates since 1973.
The surprise is the gap between two kinds of number. Anyone who watches the market sees a price that moves by the hour. The ledger does not. It keeps a legal rate for a particular claim, the gold certificate, and it has kept that rate since the early 1970s. The metal in the vaults is the same metal people mean when they say gold. The dollar figure on the certificate line is not the dollar figure on a dealer’s screen.
A certificate, not a ticket
A fine troy ounce is the old precious-metals weight — a little over thirty-one grams. “Book” here does not mean a novel. It means the accounting books: the dollar figure the Treasury assigns when it issues gold certificates against metal it holds. Those certificates are book-entry claims between the Treasury and the Federal Reserve. They are not tickets the public can cash for bars at a window.
That distinction does most of the work. A book-entry claim is a line between two parts of the government. The Treasury holds metal. It issues certificates against that metal. The Federal Reserve holds the certificates. Nothing in that arrangement is a promise that a person can walk up, hand over dollars, and leave with a bar at $42.22. The public’s price is the market price. The certificate’s price is the statute. Both can be stated on the same day without either one cancelling the other. Those certificates, and the $42.22 rate still attached to them, are what official gold book value is counting.
The rate Congress wrote in 1973
The number itself is a relic of the last official revaluation. In 1973, after Nixon had already closed the gold window in August 1971 — ending foreign official redemption of dollars for U.S. gold at a fixed price — Congress set the certificate valuation at $42 and two-ninths per fine troy ounce. That works out to $42.2222…, usually rounded in conversation to $42.22. The statute still uses that rate for outstanding gold certificates. The market price of gold is a different dial entirely. It floats. The book rate does not.
Under Bretton Woods, dollars had been tied, for foreign official holders, to gold at $35 an ounce. That tie was not a shop price for coins in a drawer. It was the rate at which foreign official holders could present dollars and receive U.S. gold. When that link broke in August 1971, the market price of gold was free to rise, fall, and rise again. The certificate book rate did not follow it around. Once Congress wrote $42 and two-ninths into the valuation of outstanding certificates in 1973, that rate stayed. One dial is a law. The other is a trade.
The same ounces, two prices
So what happens when you run the same official ounces through both dials?
Eleven billion, or about $1.15 trillion
America’s alleged official stockpile is about 261.5 million fine troy ounces — the figure long cited for Treasury gold. Multiply by $42.22 and the books show roughly eleven billion dollars. The chart that travels with the short piece prints that book column as $11.04 billion, fixed by Congress at $42.22 per ounce in 1973. Mark the same ounces to a recent spot near $4,385 and the market value jumps to about $1.15 trillion. Same metal. Two stories: one frozen in 1973 law, one written every day by buyers and sellers.
Read the multiplication slowly, because the size of the gap is the point and the arithmetic is ordinary. Start with the ounces the Treasury is long said to hold: about 261.5 million fine troy ounces. Apply the statutory certificate rate, $42.22. The product is on the order of eleven billion dollars — $11.04 billion on the chart. Apply a recent market print near $4,385 to those same ounces and the product is about $1.15 trillion. Nothing in the second product creates new bars. Nothing in the first product makes the bars disappear. The ounce count is held still. Only the dollar label changes.
That gap is not a trading tip. It is a measurement of how far the unit of account drifted from the metal after convertibility ended. Under the old official link, a foreign treasury’s dollar had a stated gold price. After the window closed, that statement no longer described a redemption. The certificate line kept a statutory dollar figure. The market kept moving. The distance between them is what the two columns show.
Debt on the other side
Now fold in the debt side of the ledger.
About $153,400 of debt per ounce
Divide roughly $40 trillion of U.S. federal debt by those 261.5 million alleged ounces and you get about $153,400 of debt for every official ounce on the books. The card beside the short piece prints the same division with a slightly tighter debt total: $40.07 trillion divided by 261.5 million ounces, landing on $153,400. The ounces are the claimed reserve. The debt is the claim on future taxpayers and future dollars. The ratio does not tell you what gold should cost. It shows how large the paper promises have grown beside the metal the government still counts at a 1973 certificate price.
The division is a ratio, not a recommendation. Take the stock of federal debt, on the order of $40 trillion in the note and $40.07 trillion on the card. Divide by the alleged official ounces, 261.5 million. The result, about $153,400, is debt per ounce. It answers a narrow question: if you spread that debt evenly across the ounces the government claims, how many dollars of debt sit on each ounce? It does not answer what a buyer should pay, and it does not say the statute ought to be rewritten. The article is explicit on that limit. The ratio shows scale. Paper promises on one side. A 1973 certificate price on the other.
Not a storefront sticker
None of this means the bars in Fort Knox, West Point, Denver, and the New York Fed’s vaults are “worth” only eleven billion in any everyday sense. Physical gold trades near the market. The $42.22 figure is an accounting convention for gold certificates — a legal yardstick left over from the era when the dollar’s gold link was being unwound, not a storefront sticker.
An accounting convention can be exact and still be a poor guide to a bar on a counter. The statute names one rate for certificates outstanding between the Treasury and the Federal Reserve. Buyers and sellers name another rate whenever a trade prints. Confusing the two is how a reader comes away thinking the United States “prices its gold at forty-two dollars” the way a dealer posts a quote. The dealer’s quote moves. The certificate rate does not. The vaults named in the note — Fort Knox, West Point, Denver, and the New York Fed — hold metal that trades near the market. The eleven-billion-dollar line is what the certificates say when the 1973 rate is applied. It is not a claim that the bars would clear at that price.
The figures in order
The figures, in the order the ledgers and the note use them.
- Weight. A fine troy ounce is the old precious-metals weight, a little over thirty-one grams. The official stock cited here is about 261.5 million of those ounces.
- 1971. In August 1971 the gold window closed. Foreign official holders could no longer redeem dollars for U.S. gold at a fixed price. Under Bretton Woods that fixed price, for those holders, had been $35 an ounce.
- 1973. Congress set the gold-certificate valuation at $42 and two-ninths per fine troy ounce. That is $42.2222…, usually said as $42.22. The statute still uses that rate for outstanding certificates.
- Book column. Ounces times $42.22 comes to roughly eleven billion dollars. The chart prints $11.04 billion.
- Market column. The same ounces at a recent spot near $4,385 come to about $1.15 trillion.
- Debt column. Roughly $40 trillion of federal debt, $40.07 trillion on the card, divided by 261.5 million alleged ounces, is about $153,400 of debt per official ounce.
- What the ratio is not. It does not say what gold should cost. It does not turn the certificate rate into a storefront sticker. The bars are not “worth” only eleven billion in everyday trade. Physical gold trades near the market.
Close
The United States still reports a vast gold stock. It still values the certificates against that stock at a statutory rate from 1973. The market long since left that rate behind. Debt, counted in dollars that are no longer redeemable for gold at a fixed price, grew into the tens of trillions. Put the alleged ounces under that debt and the per-ounce burden lands north of a hundred and fifty thousand dollars.
Vaults full of metal. Ledgers still stamped $42.22. A market that marks the same ounces in the trillions.
A shorter version of this note first appeared as an X Article.