
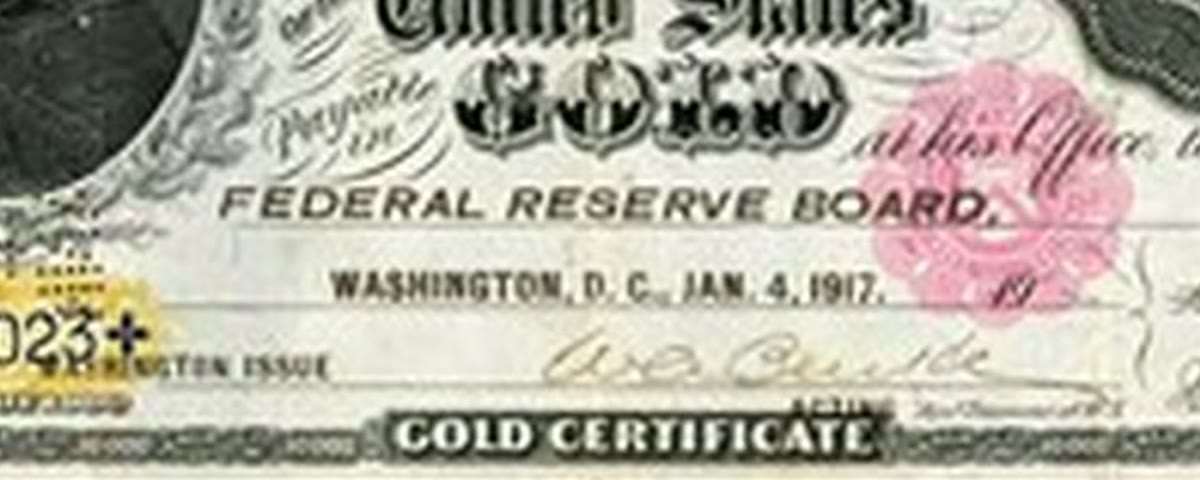
The United States Treasury still values its gold at $42.22 per fine troy ounce (a troy ounce is the precious-metal ounce, about 31.1 grams; fine means pure metal content). That is the book value: the last official dollar price of gold written into U.S. law, in 1973, and never changed since. It is not the market price quoted in London or on the U.S. futures market (COMEX), and nobody can hand the Treasury $42.22 and take away an ounce.
Book versus spot
Two numbers sit on the same pile of metal. Spot is the market price: a London afternoon fix, a COMEX nearby future, or another dated quote in dollars per troy ounce. Book is the value written into the U.S. government’s accounts. The Treasury’s Status Report of U.S. Treasury-Owned Gold, and the Federal Reserve’s H.4.1 gold-stock line, still use the statutory rate of $42.2222 per fine troy ounce — usually shortened to $42.22.
The stock itself is large and slow-moving. Treasury reports on the order of 261.5 million fine troy ounces of official gold, held mainly as “deep storage” at Fort Knox, West Point, and Denver, with a smaller working stock at the Mint. At the book rate that stock is about $11.041 billion. At a market price of two thousand dollars an ounce, the same ounces are worth more than half a trillion. The metal is the same; only the price used to count it differs.
Gold certificates issued by the Treasury to the Federal Reserve Banks match that book stock. The certificate is a claim inside the government, not a public window. No citizen, and no foreign government, can present dollars and demand those ounces at $42.22. The 1971 gold-window close ended that right for foreign official holders. The book rate survived as an accounting leftover.
How the official price got to $42.22
The Gold Reserve Act of 1934 reset the official U.S. gold price from $20.67 to $35 an ounce after the 1933 recall. Bretton Woods then used that $35 par for official dollar–gold convertibility. The market price and the official par were meant to stay near each other. After the mid-1960s they did not.
On 15 August 1971 the United States suspended convertibility for foreign official holders. In December 1971 the Smithsonian Agreement raised the official par to $38. The Par Value Modification Act of 31 March 1972 (Public Law 92-268) wrote that $38 figure into U.S. law. A further devaluation followed. Public Law 93-110 of 21 September 1973 set the par at $42.2222 per fine troy ounce.
That 1973 statute is the last official U.S. gold price. When the market floated, Congress did not raise the book rate again. Spot left $42.22 behind, and the Treasury went on carrying the same ounces at the same statutory dollars. H.4.1’s gold-stock line still prints in that book unit, not in market dollars.
Market price as a multiple of the official price
Each row divides a market price — a named day’s London price, or this site’s LBMA/COMEX year average — by the two official prices: $35, the par from 1934 to 1971, and $42.22, the book rate since 1973. For years before September 1973, the $42.22 column is a later yardstick applied backward, not a par that existed at the time.
- 1971 year average $40.62 (LBMA/COMEX series used on this site): $40.62 ÷ $35 = 1.16×; $40.62 ÷ $42.22 = 0.96×.
- 1973 year average $97.32: $97.32 ÷ $35 = 2.78×; $97.32 ÷ $42.22 = 2.31×. The $42.22 par was written that September.
- 21 January 1980 London PM $850 (this site’s 1980 gold print): $850 ÷ $35 = 24.29×; $850 ÷ $42.22 = 20.13×. The 1980 year average was $612.56 → 17.50× and 14.51×.
- 2000 year average $279.11: $279.11 ÷ $35 = 7.97×; $279.11 ÷ $42.22 = 6.61×.
- 6 September 2011 London PM $1,895: $1,895 ÷ $35 = 54.14×; $1,895 ÷ $42.22 = 44.88×. The 2011 year average was $1,571.52 → 44.90× and 37.22×.
- 2020 year average $1,769.64: $1,769.64 ÷ $35 = 50.56×; $1,769.64 ÷ $42.22 = 41.91×.
- 2024 year average $2,386: $2,386 ÷ $35 = 68.17×; $2,386 ÷ $42.22 = 56.51×.
The 1973 statute was already behind the market in the year it was passed, and by 2024 the average price was more than fifty-six times the book rate. Both numbers are correct at once, because they answer different questions: one is an accounting entry, the other is what the metal fetches.
What the book number is for
Government accounts need a dollar figure for every asset. After 1973 the United States chose not to mark official gold to the market on the main Treasury gold line, so the book stays at $42.22. Market-value figures — ounces times spot — appear in commentary and on this site’s desk. They are useful, but they are a calculation, not the statute.
Other countries handle gold differently. Some central banks revalue gold toward market prices on their own balance sheets; some keep a historical cost. The IMF’s International Financial Statistics report physical gold and a dollar value used for reserve arithmetic. How those conventions shape reserve figures is covered in central-bank gold reserves.
Two ledgers, one stock
When a headline says the United States holds about $11 billion in gold, it is using the book rate. When another puts the figure above a trillion dollars, it is multiplying the same 261.5 million ounces by a market price — at the July 2026 London price of $4,026.60, about $1.05 trillion. Neither headline is wrong. Knowing which price sits behind the number is the whole trick.
How $35 and then $42.22 became law, and why convertibility ended, is told in Sound Money History, starting from the 1971 episode linked above.
What the official gold stock is worth next to the federal debt
The latest Status Report of U.S. Government Gold Reserve is the FiscalData table of U.S. Treasury-owned gold dated 31 August 2026. Its facility lines add to 261,498,926.241 fine troy ounces, the stock described above as about 261.5 million ounces. The report books that gold at $11,041,059,957.90, about $11.041 billion — the statutory $42.2222 per fine troy ounce, carried on the same metal. The LBMA Gold Price PM on 24 September 2026 was $4,266.40. Those ounces times that afternoon London price come to $1,115,659,018,914.60, about $1.116 trillion.
On 7 October 2026, FiscalData’s Debt to the Penny put total public debt outstanding at $40,284,036,147,367.19. From the 23 September 2026 figure of $40,073,558,531,201.68, that total is higher by $210,477,616,165.51, about $210 billion. The market value is 2.769 percent of the 7 October 2026 debt. The book value, set beside it, is 0.027 percent. The ounces do not change between the two shares; the price used to count them does. In tonnes, that U.S. stock is the largest official holding ranked on central-bank gold reserves. Interest costs vs U.S. gold sets a year of federal interest beside the same ounces.
The same debt and the same ounces can be turned around into a gold price. Debt multiplied by a share, then divided by 261,498,926.241, is the price per fine troy ounce at which this stock equals that share of the 7 October 2026 debt. The table is that arithmetic. Each row holds the debt and the ounces fixed and changes only the share.
| Share of the debt | Gold price per ounce |
|---|---|
| 5% | $7,702.52 |
| 10% | $15,405.05 |
| 20% | $30,810.10 |
| 50% | $77,025.24 |
| 100% | $154,050.48 |
Total public debt outstanding changes on business days, and the government’s gold is not earmarked to repay it. The rows compare the size of the stock with the size of the debt on the dates above.
Sources: Debt to the Penny, 7 October 2026 and 23 September 2026; U.S. Treasury-owned gold (Status Report of U.S. Government Gold Reserve), August 2026; LBMA Gold Price PM, 24 September 2026.